Strategic Decision-Making.
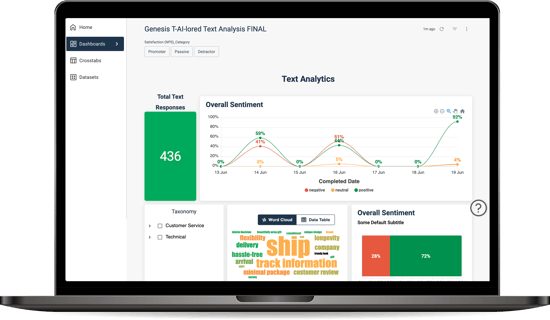
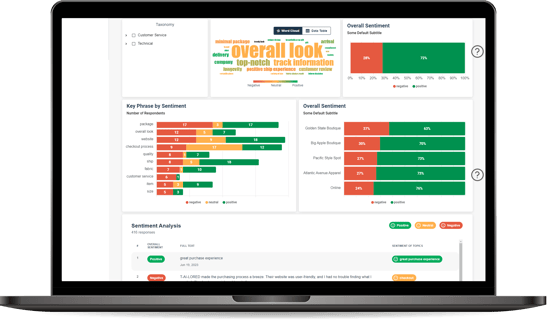
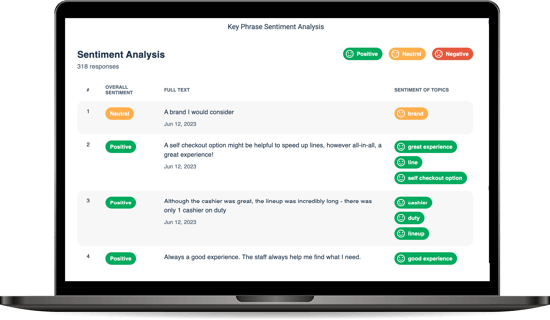
From existing feedback programs to third-party data, dive deep into the why behind customer behavior and preferences. By understanding the subtleties of customer feedback, businesses can tailor their strategies to enhance customer satisfaction and drive growth.
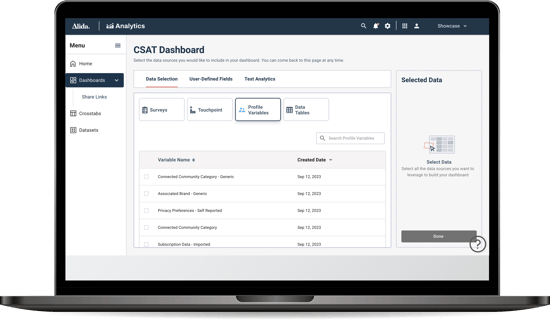
Easy to Use
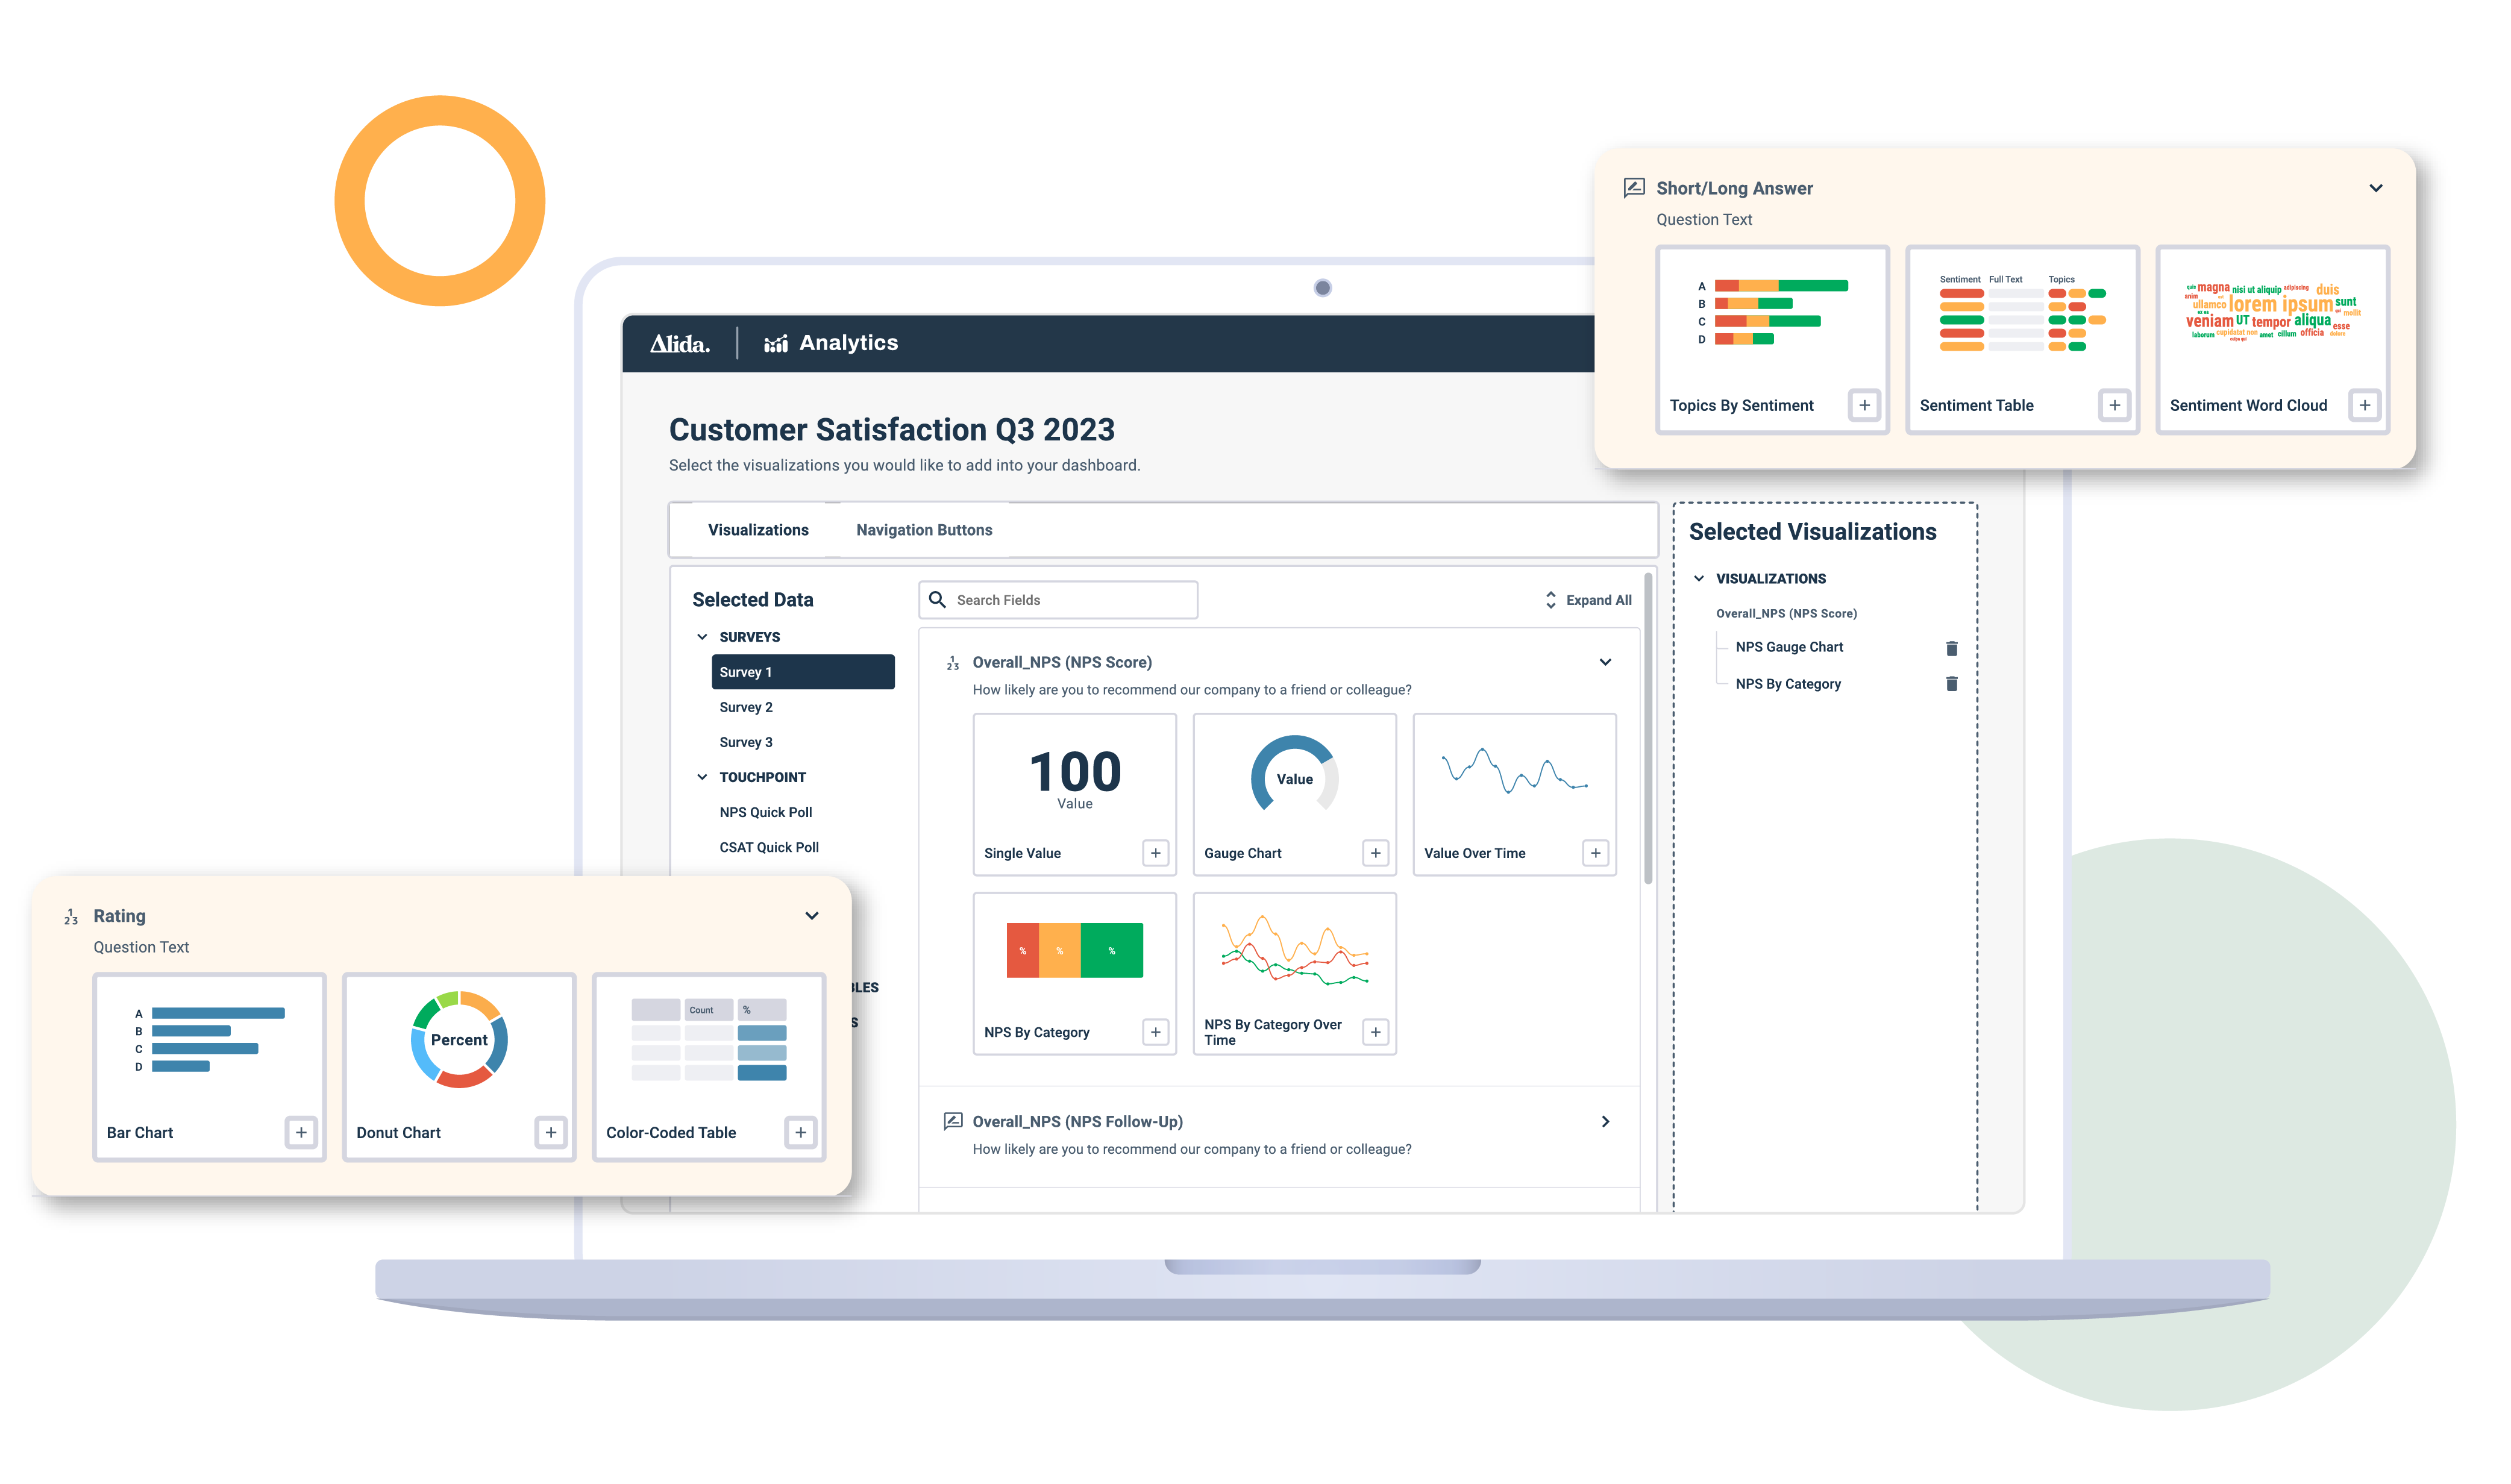
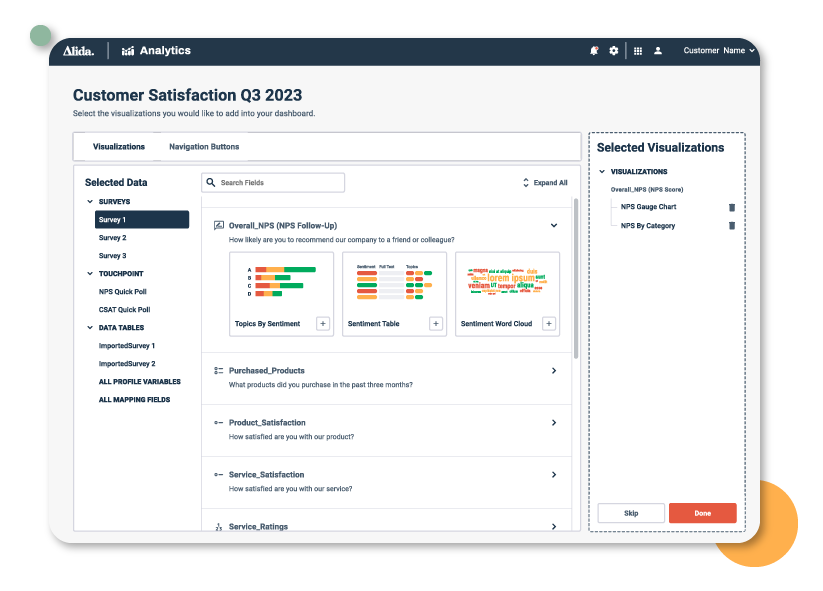
Empower your teams to focus on interpreting the data and taking action with the Visualization Assistant. Using automated, smart tile suggestions, creating and updating dashboards is intuitive, efficient, and purpose-built for DIY.
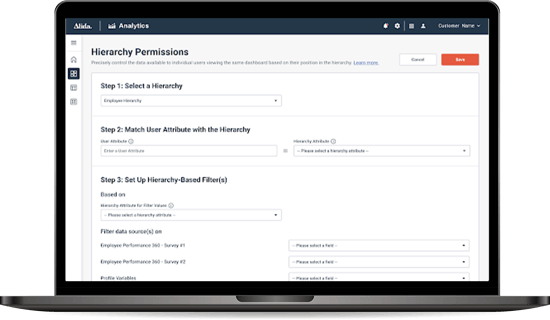
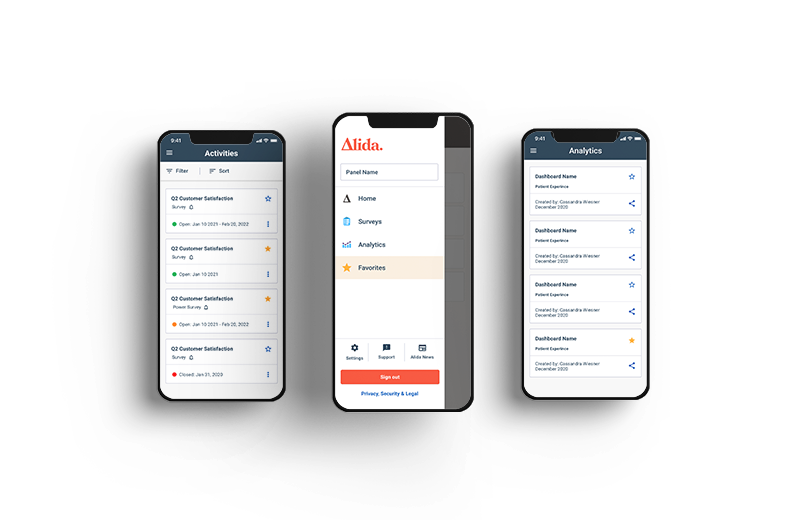
Whether you need high-level executive summaries or granular insights for specific teams, these dashboards scale to fit your needs.