A key decision when planning a survey is to determine the size of the sample. We can help you cover the basics.
Seasoned folks in the Customer Experience (CX) and Insights spaces know that surveys are only one piece of the puzzle. The next piece to tackle is a bit more complicated: what is the right sample size to achieve your goal for each engagement? In other words, what variables should you consider for your ideal sample size?
Discovery questions
We put together a series of discovery questions to help you think through your sampling strategy for your Alida Insight Community or CX program, and included different options for various scenarios.
How do we define a sample?
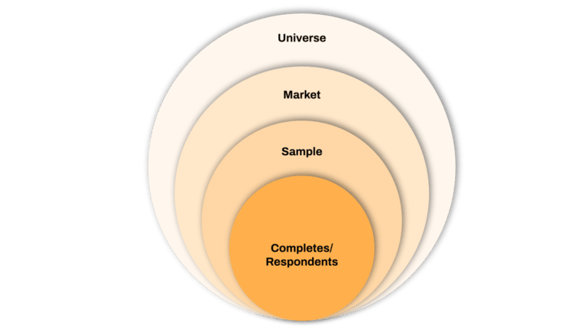
When selecting your sample, consider the following parameters:
- Universe: Total amount of people who have a certain set of characteristics
- Example: General US market
- Example: Millennial women with kids in Canada
- Market: Subset of the universe with a common set of consumer behaviors
- Example: Cell phone users in North America
- Example: Drive-through morning coffee drinkers
- Sample: Subset of the market that’s selected to understand broader behaviors; people who are selected to provide feedback for research
- Completes/Respondents: Subset of the sample who provided feedback for a research activity
What are the key aspects when selecting a sample?
There are a some proportions that are relevant to understand before you start defining your sample:
- Incidence: Percentage of the universe that fall within a specific market (e.g. with a common set of consumer behaviors that match the sample criteria)
- Example: Market / Universe*100
- Participation rate: Percentage of the sample who started a research activity
- Abandonment/Drop rate: Percentage of the sample who started a research activity but did not complete it
- Response/Completion rate: Percentage of the sample who provided feedback for a research activity
- Example: Response rate + Abandonment rate = Participation rate
- Example: Completes or Respondents / Sample * 100
- Sample distribution: Proportion of participants across segments or demographic groups
What are the different strategies to selecting a sample?
When selecting a sample you can use different approaches:
- Random sample: A sample where all potential respondents have the same chance of being selected out of the universe
- NOTE: Sampling from an Alida Insight Community is similar to a randomly-selected sample because each member has the same opportunity to be selected
- Representative sample: A sample that matches the composition of the universe in terms of demographics or consumer behaviors
- Convenience sample: A sample where potential respondents are selected based on ease of access/simplicity
- Census sample: A sample that includes all members of the universe
- Augmentation/Boost: Additional sample intentionally selected to increase the number of respondents in a specific group/segment
- Subgroups: Breaking a sample into defined groups based on demographics or consumer behaviors. Defining subgroups allows you to have a better understanding of your market and target relevant clients as necessary
- Quotas: Setting maximum completion targets/goals for a variety of segments or demographic groups
What are the key statistical concepts to consider when selecting a sample?
You may have heard one or more of the following concepts that are relevant when working on sample selection:
- Statistical significance testing: “Statistical significance helps quantify whether a result is likely due to chance or to some factor of interest.” (Source: A Refresher on Statistical Significance)
- Confidence level: How confident you are that the results will represent the universe or market (Source: Choosing a Confidence Level for a Population Sample)
- Margin of error: “A margin of error tells you how many percentage points your results will differ from the real population value. For example, a 95% confidence interval with a 4 percent margin of error means that your statistic will be within 4 percentage points of the real population value 95% of the time.” (Source: Margin of Error: Definition, Calculate in Easy Steps)
- Weighting: “Weighting is a correction technique that is used by survey researchers. It refers to statistical adjustments that are made to survey data after they have been collected in order to improve the accuracy of the survey estimates. There are two basic reasons that survey researchers weigh their data. One is to correct for unequal probabilities of selection that often have occurred during sampling. The other is to try to help compensate for survey nonresponse.” (Source: Weighting)
Sample size recommendations for expected completion or response rates
The sample size recommendations below are general guidelines to build a sample that meets your needs. You may have to consider different completion rates for different segments to decide how many invitations to send to achieve a specific number of respondents (e.g. minimum completes) per segment.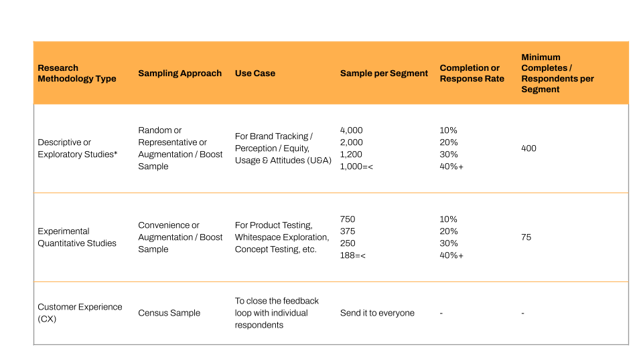
* 95% confidence level and 5% margin of error
If you want an exact calculation of your sample size, you can use a sample calculator like this one: https://www.calculator.net/sample-size-calculator.html
If you don’t have an Alida Insight Community, you can apply the same logic to your existing CX program, panel study, or customer database.
We hope this helps you think through and decide upon your sampling approach!

Andrea Ortegon, Director of Research Services at Alida
As a Director of Research Services, Andrea brings her research and project management experience in combination with her cultural background, to coordinate a diverse group of research professionals supporting Alida’s customers in their use of our platforms to gather insights.

Amy Ko, Principal CX Consultant at Alida
Amy is a Principal CX Consultant on the Professional Services team at Alida. She is responsible for thought leadership, best practices, and shaping the CX Practice.